A dashboard is only useful if the numbers on it are current and trustworthy. Autovella's analytics read directly from the same time entries, expenses, and task data your team logs day to day, so what you see in a report matches what's actually happening in delivery, not a snapshot from whenever someone last exported a spreadsheet.
In this guide
Project profitability and marginUtilization and capacityEarned-value management and schedule performanceDelivery and sprint velocityFrequently asked questions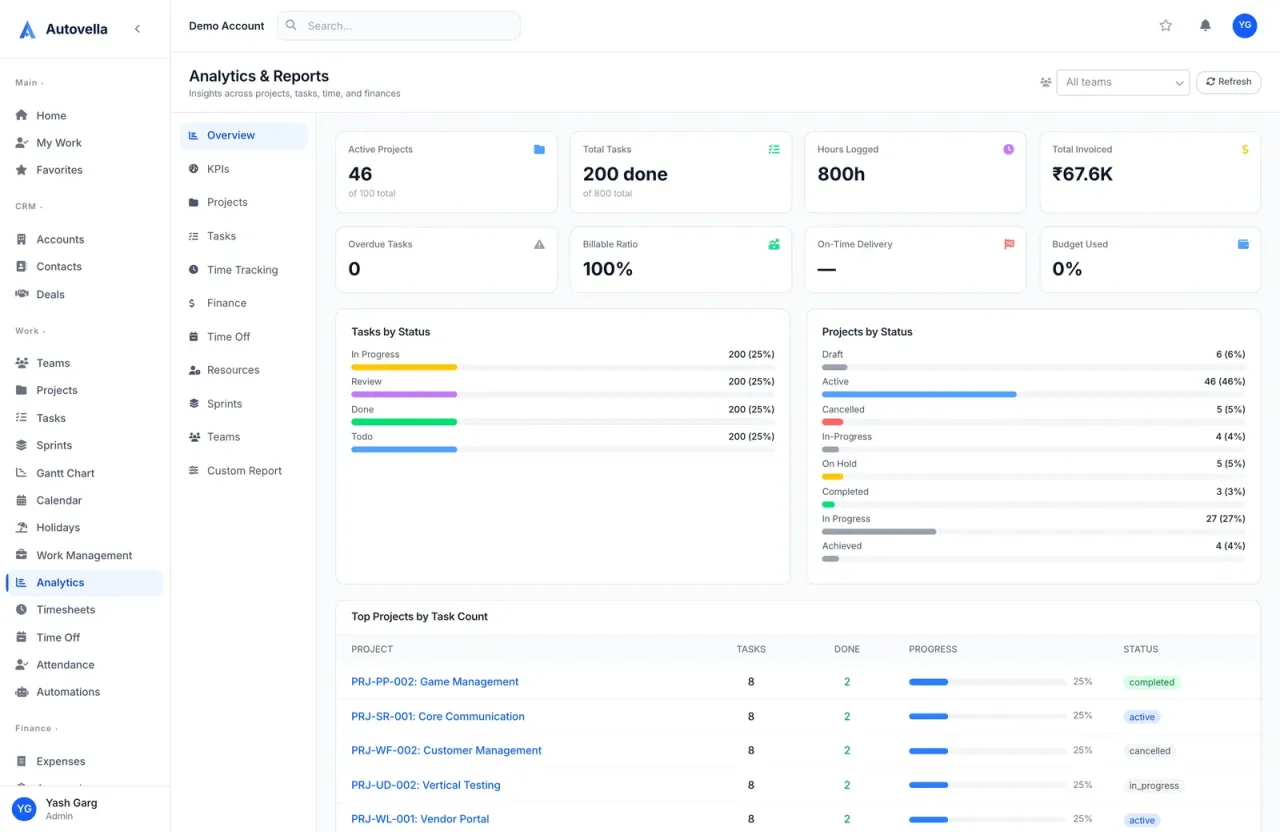
Project Profitability and Margin
The profitability dashboard compares a project's budget against actual cost, billable time at cost rate plus expenses, in real time. Margin is visible per project, per client, or rolled up across the whole firm, which makes it possible to catch a project drifting over budget in week three instead of discovering it at close-out.
Utilization and Capacity
Utilization rate, the percentage of available hours logged as billable, is calculated automatically from time entries, time off, and holiday calendars (see Managing Time Off, Holidays and Attendance). View it per person, per team, or firm-wide, and use it alongside resourcing views to see who has capacity for new work before you staff a project.
Earned-Value Management and Schedule Performance
For projects tracked against a budget and timeline, Autovella calculates standard earned-value metrics, planned value, earned value, cost variance, and schedule performance index, without requiring a separate EVM spreadsheet. A schedule performance index below 1.0 signals a project falling behind plan before it shows up as a missed deadline.
Delivery and Sprint Velocity
- Burndown charts show remaining work against time for any sprint or project
- Velocity tracks completed story points per sprint, useful for capacity planning future sprints
- Task cycle time (time from start to done) highlights where work tends to stall
- All charts filter by project, team, or date range without needing a custom report built from scratch
See Working with Tasks for how sprint and Gantt views feed these metrics.
See live dashboards built from real delivery data
We'll walk through profitability, utilization, and EVM reporting for your kind of projects.
Frequently asked
Dashboards read live from the same time, expense, and task data your team logs, there's no overnight batch process or manual refresh required, a time entry logged and approved this morning is reflected in profitability and utilization numbers immediately.
Yes, every dashboard supports filtering by project, client, team, and date range, so you can view firm-wide numbers or drill into a single account's profitability without building a separate report.
No, EVM metrics are calculated for any project with a budget and timeline set, regardless of whether the team works in agile sprints, waterfall phases, or a mix. The metrics simply compare planned versus actual progress and cost.